环境信息
使用的 hadoop 完全分布式集群
1 | 192.168.2.241 hadoop01 |
所有组件均已完成安装(参考前文), 以收集 nginx 日志为例
- /opt/bigdata/filebeat/current/filebeat-nginx-to-kafka.yml
1 | filebeat.inputs: |
启动1
2cd /opt/bigdata/filebeat/current/
nohup ./filebeat -e -c filebeat-nginx-to-kafka.yml &
- /opt/bigdata/logstash/current/kafka_nginx_into_es.conf
1
2
3
4
5
6
7
8
9
10
11
12
13
14
15
16
17
18
19
20
21
22
23
24
25
26
27
28
29
30
31
32input {
kafka {
bootstrap_servers => "hadoop01:9092,hadoop02:9092,hadoop03:9092"
topics => ["nginxlogs"]
add_field => { "[@metadata][myid]" => "nginxlogs" }
}
}
filter {
if [@metadata][myid] == "nginxlogs" {
grok {
match => { "message" => "%{TIMESTAMP_ISO8601:localtime}\|\~\|%{IPORHOST:clientip}\|\~\|(%{GREEDYDATA:http_user_agent})\|\~\|(%{DATA:http_referer})\|\~\|%{GREEDYDATA:media_id}\|\~\|%{GREEDYDATA:nginx_id}" }
}
date {
match => ["localtime", "yyyy-MM-dd'T'HH:mm:ssZZ"]
target => "@timestamp"
}
mutate {
remove_field => "@version"
remove_field => "message"
remove_field => "localtime"
}
}
}
output {
if [@metadata][myid] == "nginxlogs" {
elasticsearch {
hosts => ["hadoop01:9200","hadoop02:9200","hadoop03:9200"]
index => "nginxlogs-%{+YYYY.MM.dd}"
}
}
}
启动1
2cd /opt/bigdata/logstash/current/
nohup bin/logstash -f kafka_nginx_into_es.conf &
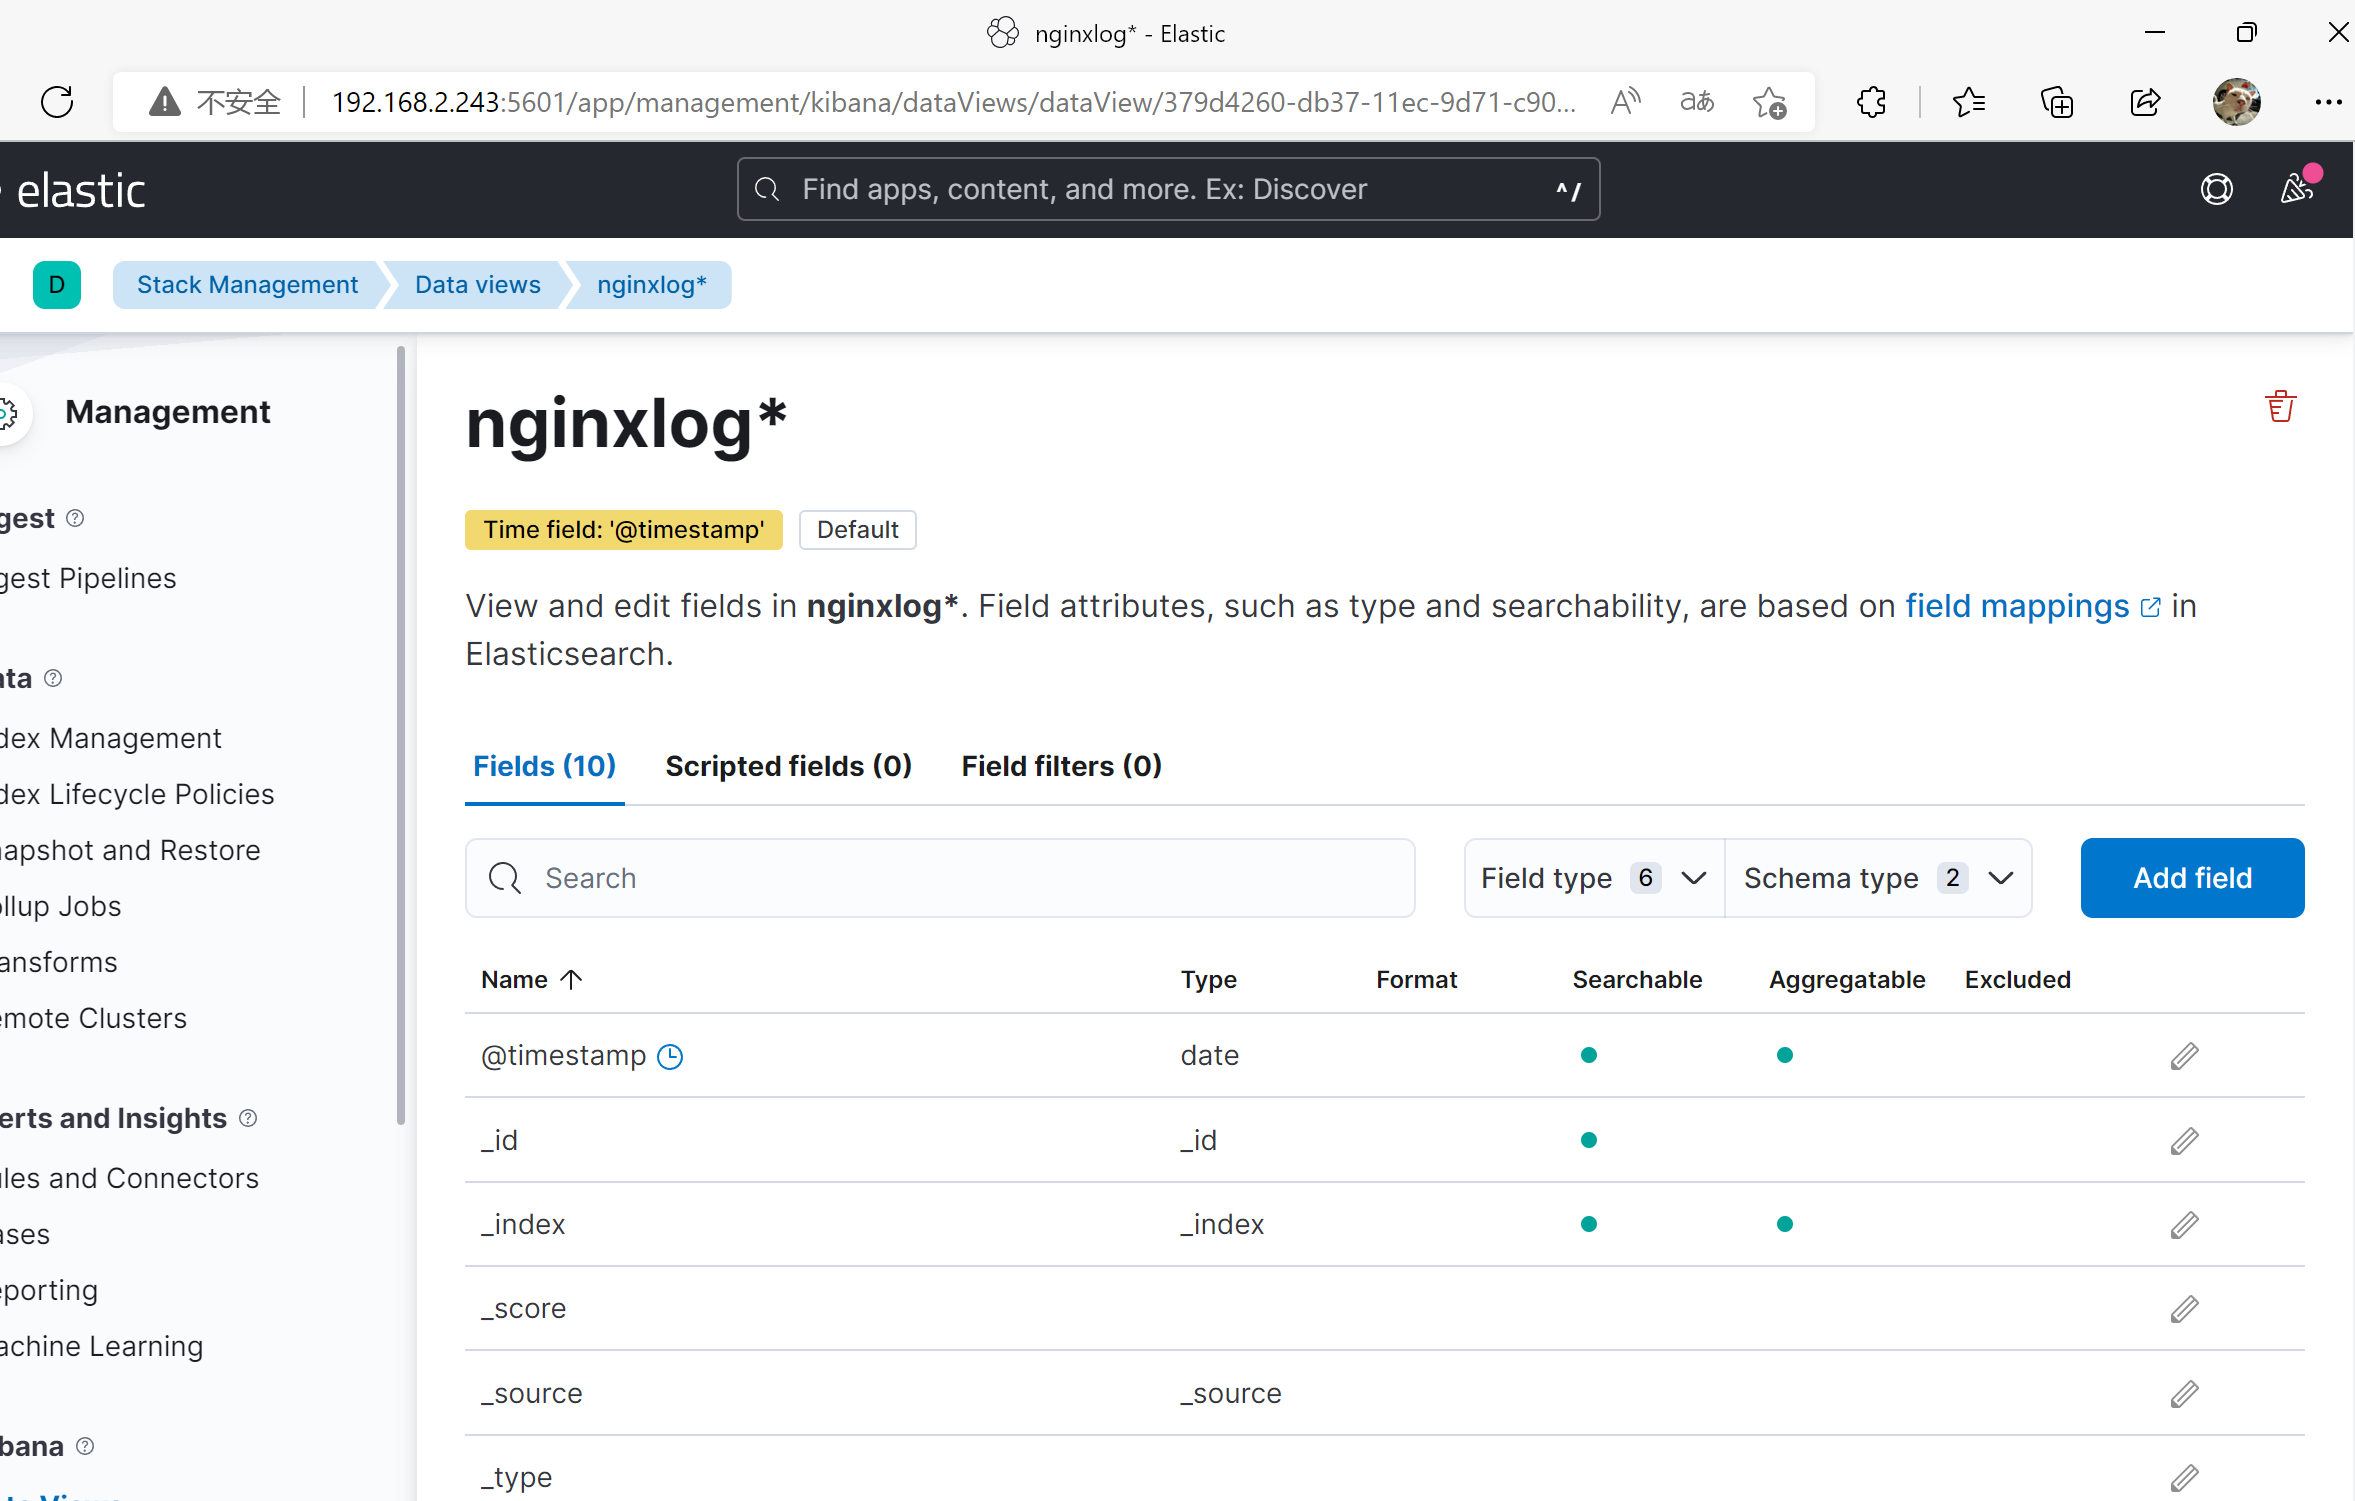
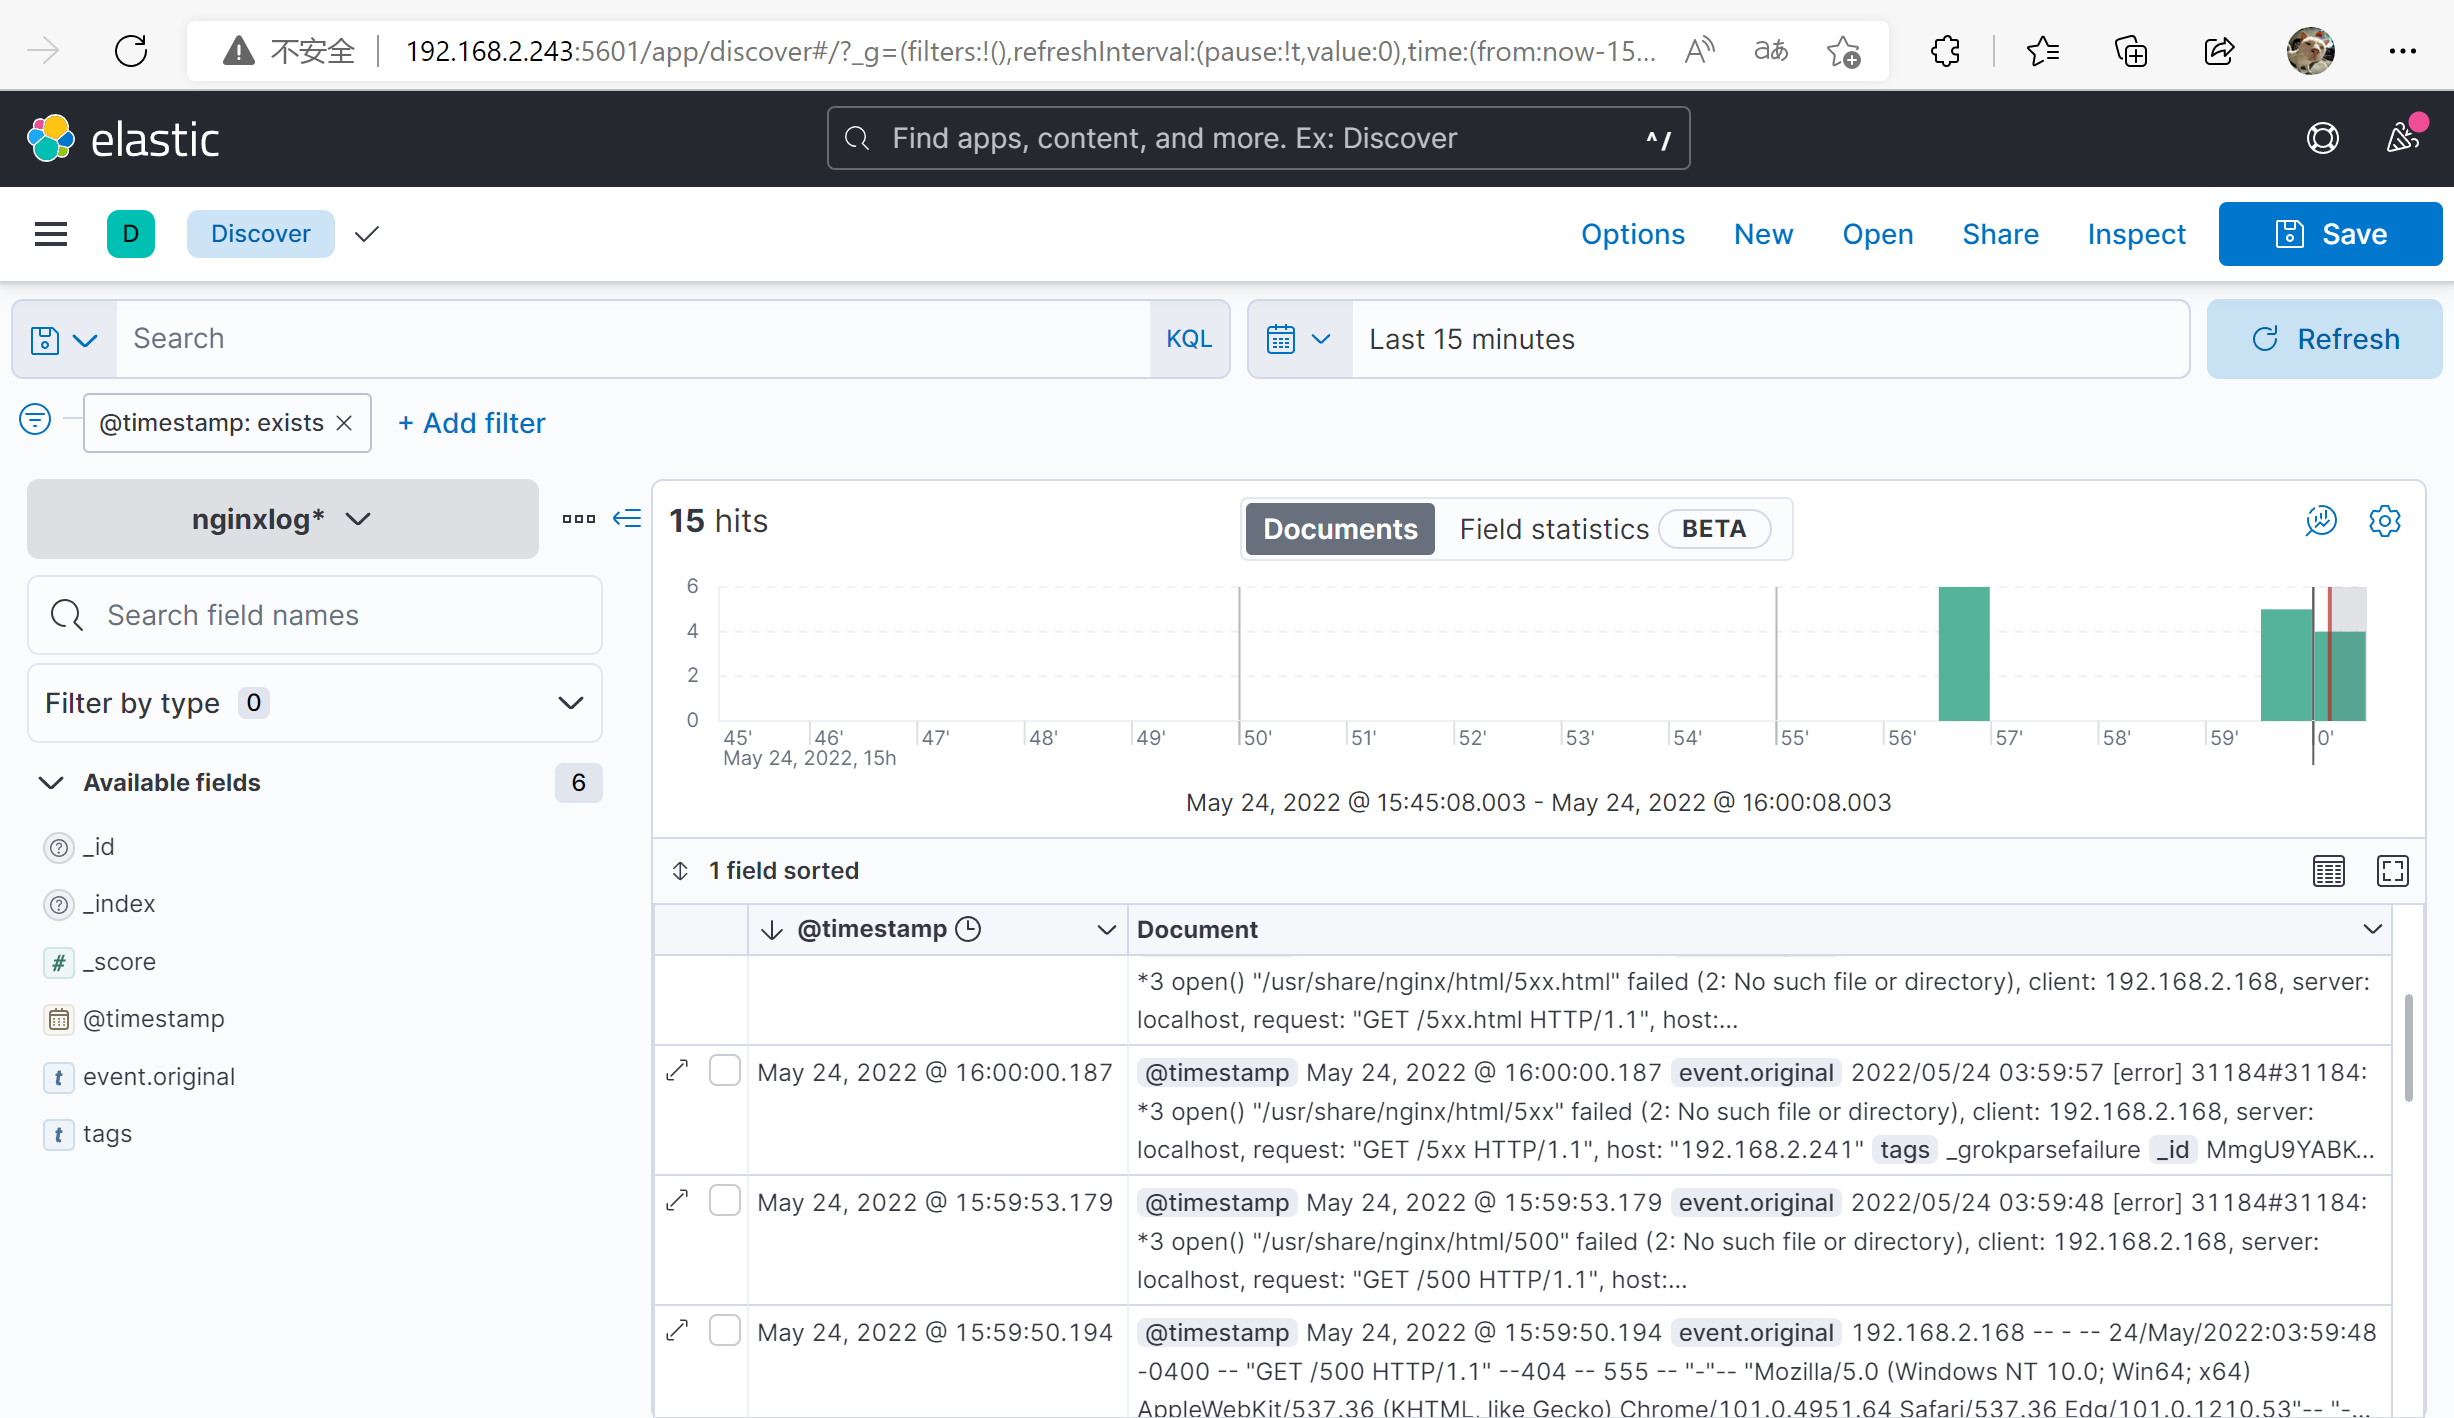
验证
使用 kibana