k6 的主要用途
- 负载测试
模拟高并发用户访问,检测服务在高流量下的性能表现。 - 基准测试
测试系统在不同负载下的响应时间、吞吐量和资源使用情况。 - 回归测试
确保代码更新不会引入性能回退。 - 容量测试
测试系统的最大承载能力,发现性能瓶颈。
搭建
- 使用 Docker, xk6-dashboard 扩展,将 k6 性能测试结果发送到 Grafana
1 | mkdir xk6-dashboard-docker && cd xk6-dashboard-docker |
- docker-compose.yml 文件, 运行 grafana 和 influxdb # 也可以使用 prometheus 等别的输出
1 | version: '3.7' |
docker-compose up -d
- k6 测试脚本
1 | import http from 'k6/http'; |
- 构建带 xk6-dashboard 的 k6 Docker 镜像
Dockerfile
1 | FROM golang:1.20 AS builder |
docker build -t imwl/custom-k6 .
- 运行性能测试
1 | # docker run --rm --network="host" -v $(pwd)/script.js:/script.js imwl/custom-k6 run --out influxdb=http://localhost:8086/k6 /script.js |
验证
配置数据源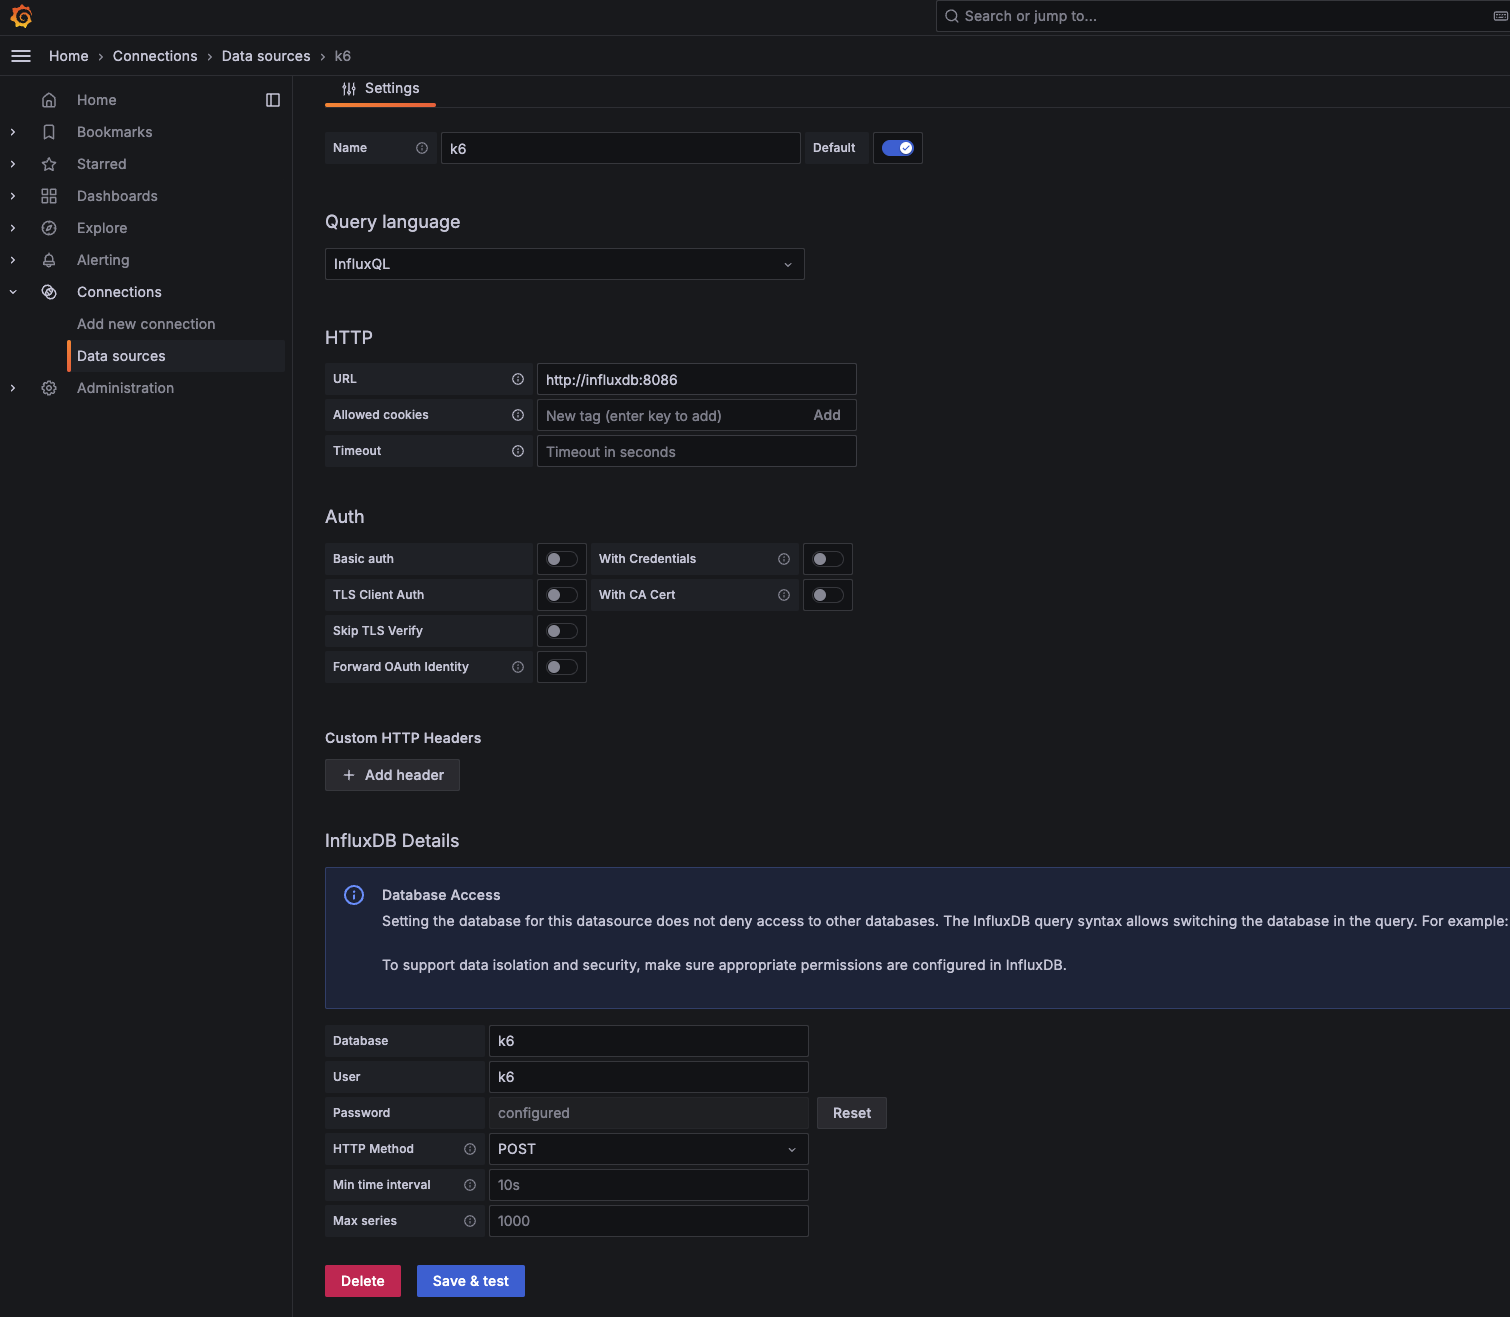
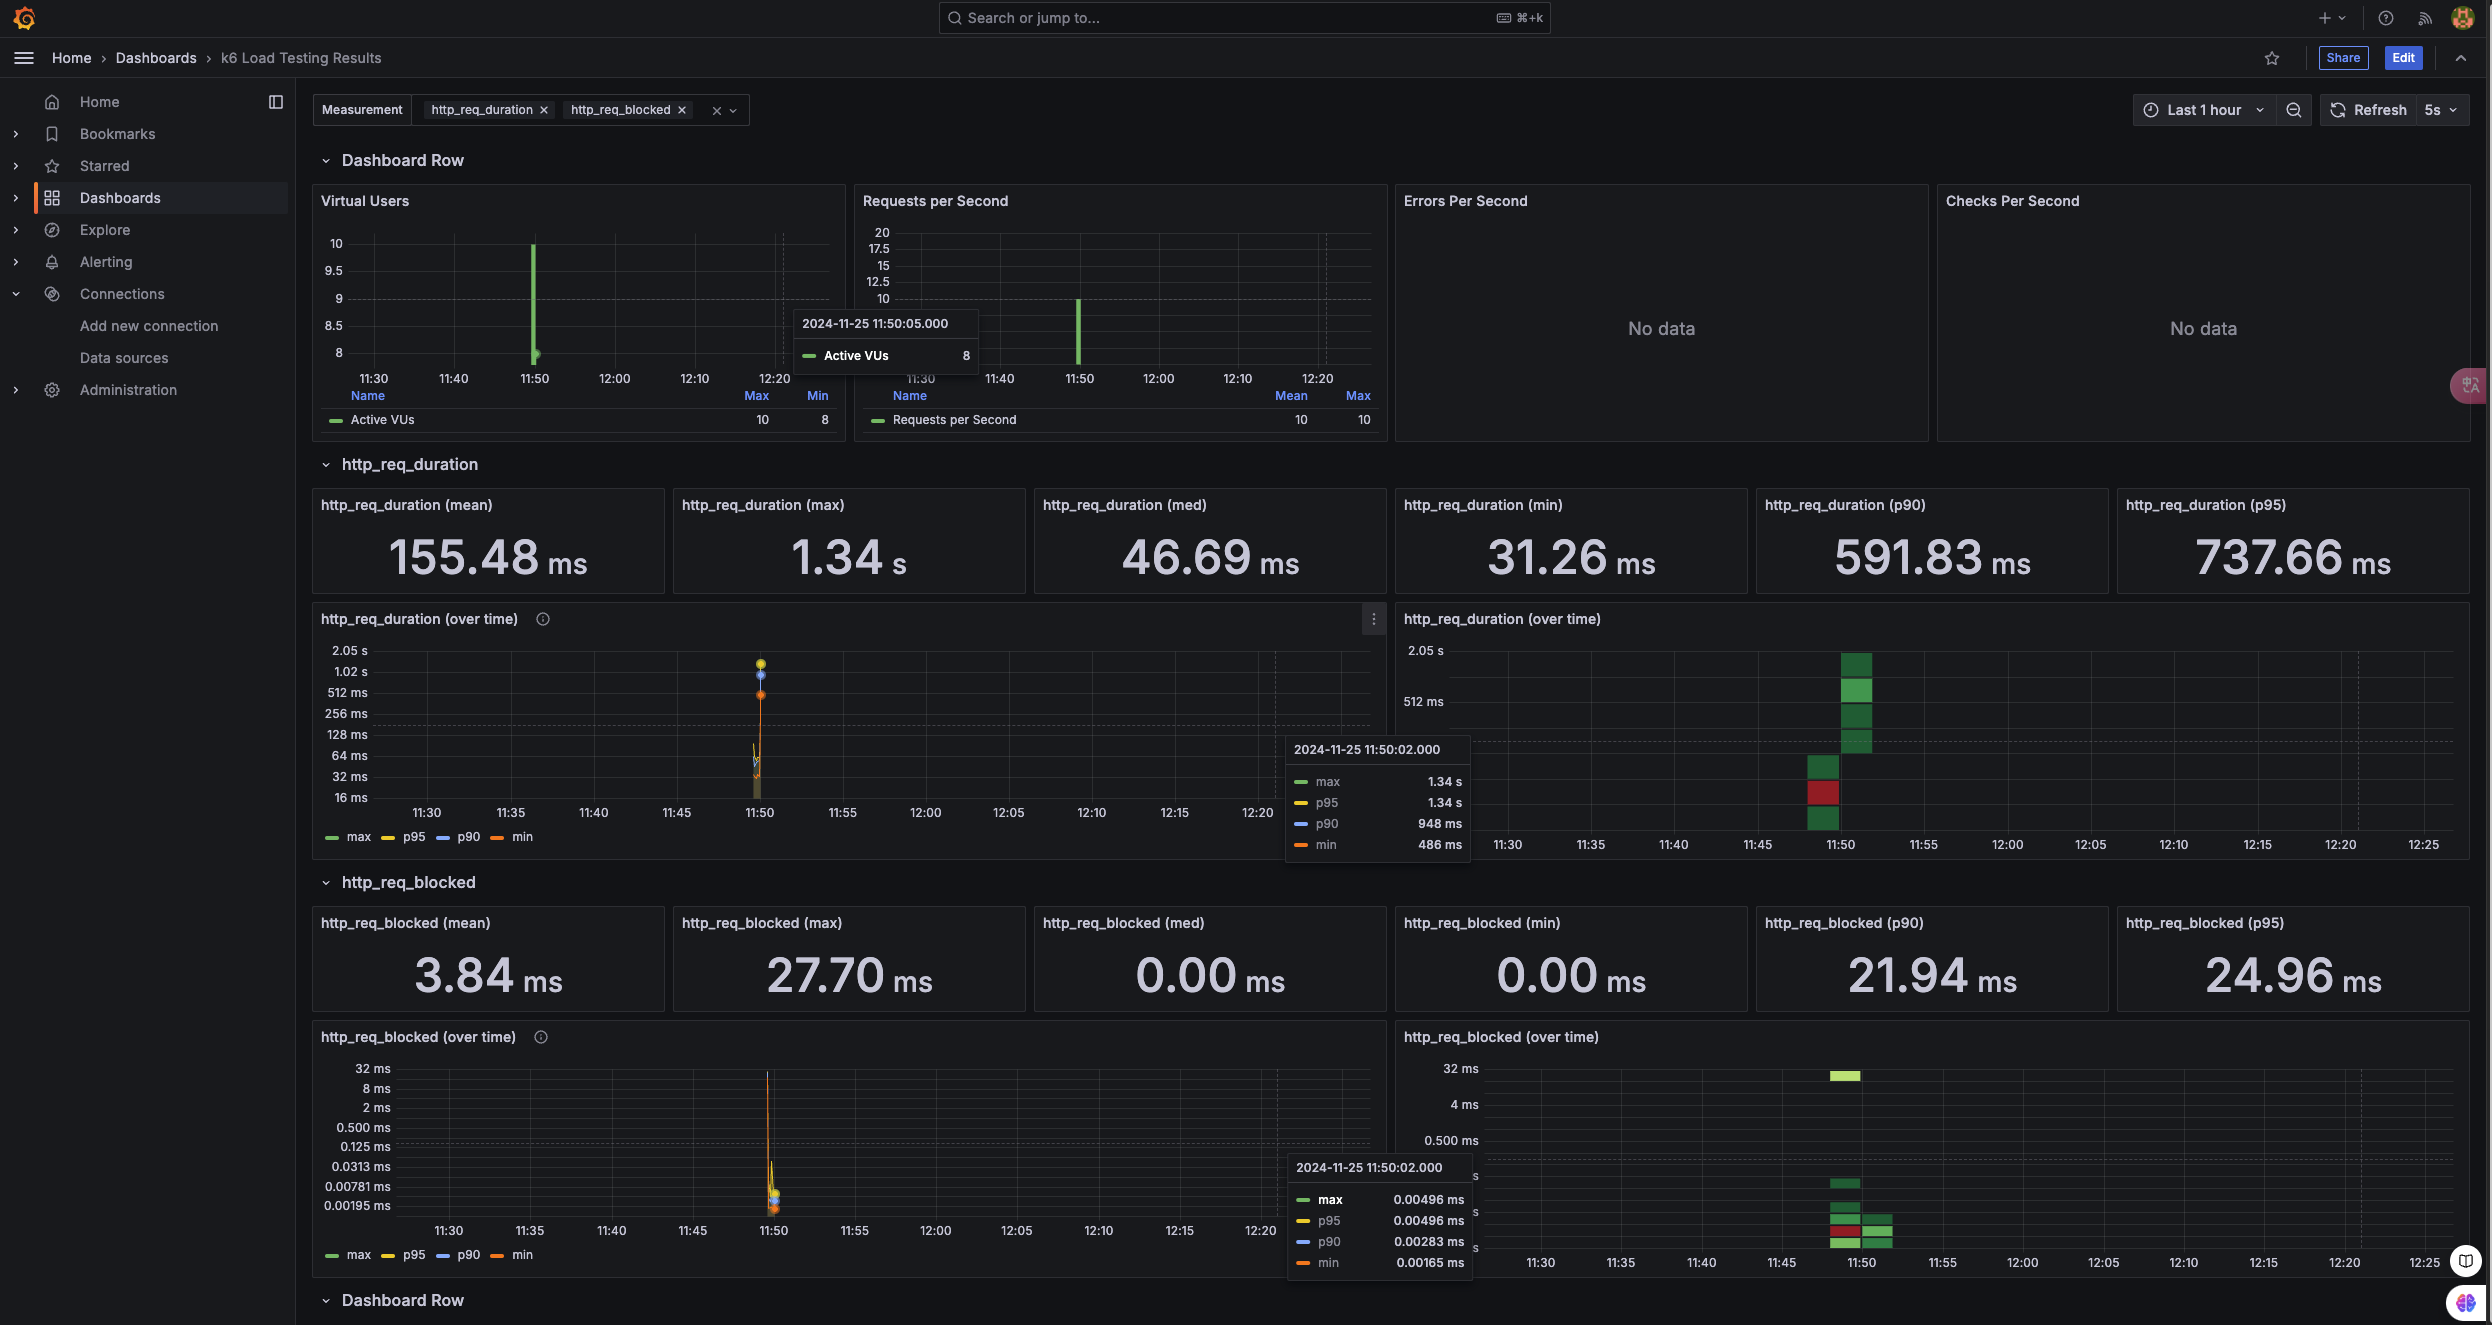
导入 K6 官方仪表板
在 Grafana 中点击左侧菜单 “Dashboards” > “Import”
输入 K6 官方仪表板的 ID:2587
点击 Load,选择数据源为刚添加的 InfluxDB
点击 Import,导入完成
界面验证